import numpy as npIf you want to try the examples in this tutorial:



1 Introduction
This chapter serves as an introduction to Numpy to ensure that the basics of vector calculations with Python are mastered. The first part of the chapter presents small exercises to practice some basic functions of Numpy. The end of the chapter presents more in-depth practical exercises using Numpy.
It is recommended to regularly refer to the numpy cheatsheet and the official documentation if you have any doubts about a function.
In this chapter, we will adhere to the convention of importing Numpy as follows:
We will also set the seed of the random number generator to obtain reproducible results:
import numpy as np
rng = np.random.default_rng(seed=12345)
CautionCaution
Historically, random numbers were generated using the numpy.random package. However, the authors of Numpy now recommend using generators instead. The examples in this tutorial adopt this practice.
2 Concept of array
In the world of data science, as will be discussed in more depth in the upcoming chapters, the central object is the two-dimensional data table. The first dimension corresponds to rows and the second to columns. If we only consider one dimension, we refer to a variable (a column) of our data table. It is therefore natural to link data tables to the mathematical objects of matrices and vectors.
NumPy (Numerical Python) is the foundational brick for processing numerical lists or strings of text as matrices. NumPy comes into play to offer this type of object and the associated standardized operations that do not exist in the basic Python language.
The central object of NumPy is the array, which is a multidimensional data table. A Numpy array can be one-dimensional and considered as a vector (1d-array), two-dimensional and considered as a matrix (2d-array), or, more generally, take the form of a multidimensional object (Nd-array), a sort of nested table.
Simple arrays (one or two-dimensional) are easy to represent and cover most of the use-case related to Numpy. We will discover in the next chapter on Pandas that, in practice, we usually don’t directly use Numpy since it is a low-level library. A Pandas DataFrame is constructed from a collection of one-dimensional arrays (the variables of the table), which allows performing coherent (and optimized) operations with the variable type. Having some Numpy knowledge is useful for understanding the logic of vector manipulation, making data processing more readable, efficient, and reliable.
Compared to a list,
- an array can only contain one type of data (
integer,string, etc.), unlike a list. - operations implemented by
Numpywill be more efficient and require less memory.
Geographical data will constitute a slightly more complex construction than a traditional DataFrame. The geographical dimension takes the form of a deeper table, at least two-dimensional (coordinates of a point). However, geographical data manipulation libraries will handle this increased complexity.
2.1 Creating an array
We can create an array in several ways. To create an array from a list, simply use the array method:
np.array([1,2,5])array([1, 2, 5])It is possible to add a dtype argument to constrain the array type:
np.array([["a","z","e"],["r","t"],["y"]], dtype="object")array([list(['a', 'z', 'e']), list(['r', 't']), list(['y'])], dtype=object)There are also practical methods for creating arrays:
- Logical sequences:
np.arange(sequence) ornp.linspace(linear interpolation between two bounds); - Ordered sequences: array filled with zeros, ones, or a desired number:
np.zeros,np.ones, ornp.full; - Random sequences: random number generation functions:
rng.uniform,rng.normal, etc. whererngis a random number generator; - Matrix in the form of an identity matrix:
np.eye.
This gives, for logical sequences:
np.arange(0,10)array([0, 1, 2, 3, 4, 5, 6, 7, 8, 9])np.arange(0,10,3)array([0, 3, 6, 9])np.linspace(0, 1, 5)array([0. , 0.25, 0.5 , 0.75, 1. ])For an array initialized to 0:
np.zeros(10, dtype=int)array([0, 0, 0, 0, 0, 0, 0, 0, 0, 0])or initialized to 1:
np.ones((3, 5), dtype=float)array([[1., 1., 1., 1., 1.],
[1., 1., 1., 1., 1.],
[1., 1., 1., 1., 1.]])or even initialized to 3.14:
np.full((3, 5), 3.14)array([[3.14, 3.14, 3.14, 3.14, 3.14],
[3.14, 3.14, 3.14, 3.14, 3.14],
[3.14, 3.14, 3.14, 3.14, 3.14]])Finally, to create the matrix \(I_3\):
np.eye(3)array([[1., 0., 0.],
[0., 1., 0.],
[0., 0., 1.]])
TipExercise 1
Generate:
- \(X\) a random variable, 1000 repetitions of a \(U(0,1)\) distribution
- \(Y\) a random variable, 1000 repetitions of a normal distribution with zero mean and variance equal to 2
- Verify the variance of \(Y\) with
np.var
3 Indexing and slicing
3.1 Logic illustrated with a one-dimensional array
The simplest structure is the one-dimensional array:
x = np.arange(10)
print(x)
[0 1 2 3 4 5 6 7 8 9]Indexing in this case is similar to that of a list:
- The first element is 0
- The nth element is accessible at position \(n-1\)
The logic for accessing elements is as follows:
x[start:stop:step]With a one-dimensional array, the slicing operation (keeping a slice of the array) is very simple. For example, to keep the first K elements of an array, you would do:
x[:K]In this case, you select the K\(^{th}\) element using:
x[K-1]To select only one element, you would do:
x = np.arange(10)
x[2]np.int64(2)The syntax for selecting particular indices from a list also works with arrays.
TipExercise 2
Take x = np.arange(10) and…
- Select elements 0, 3, 5 from
x - Select even elements
- Select all elements except the first
- Select the first 5 elements
np.arange(10)array([0, 1, 2, 3, 4, 5, 6, 7, 8, 9])The same logic applies to multidimensional arrays. Indexing then takes place at several levels. Take, for example, a 2-dimensional array (a matrix of sorts):
x = np.array([[1, 2, 3], [4, 5, 6]], np.int32)If we want to select the 2nd row, 3rd column (the element with value 6), we do
x[1, 2]np.int32(6)Now, to select a complete column (e.g. the 2nd), we can use the 2nd index to specify it (index 1 in Python since indexing starts from 0) and then : on the first dimension (shortened version of 0:N) to avoid discriminating according to this dimension:
x[:,1]array([2, 5], dtype=int32)The principle is generalized, but becomes more complex, for nested arrays. Fortunately, these are objects we rarely manipulate directly, as most of our numerical data are flat arrays (a value - the observation - is the intersection of a row - the individual - and a column - the variable).
3.2 Regarding performance
A key element in the performance of Numpy compared to lists, when it comes to slicing, is that an array does not return a copy of the element in question (a copy that costs memory and time) but simply a view of it.
When it is necessary to make a copy, for example to avoid altering the underlying array, you can use the copy method:
x_sub_copy = x[:2, :2].copy()It is also possible, and more practical, to select data based on logical conditions (an operation called a boolean mask). This functionality will mainly be used to perform data filtering operations.
For simple comparison operations, logical comparators may be sufficient. These comparisons also work on multidimensional arrays thanks to broadcasting, which we will discuss later:
x = np.arange(10)
x2 = np.array([[-1,1,-2],[-3,2,0]])
print(x)
print(x2)
[0 1 2 3 4 5 6 7 8 9]
[[-1 1 -2]
[-3 2 0]]x==2
x2<0array([[ True, False, True],
[ True, False, False]])To select the observations related to the logical condition, just use the numpy slicing logic that works with logical conditions.
TipExercise 3
Given
x = np.random.normal(size=10000)- Keep only the values whose absolute value is greater than 1.96
- Count the number of values greater than 1.96 in absolute value and their proportion in the whole set
- Sum the absolute values of all observations greater (in absolute value) than 1.96 and relate them to the sum of the values of
x(in absolute value)
Whenever possible, it is recommended to use numpy’s logical functions (optimized and well-handling dimensions). Among them are:
count_nonzero;isnan;anyorallespecially with theaxisargument ;np.array_equalto check element-by-element equality.
Let’s create x a multidimensional array and y a one-dimensional array with a missing value.
# Assuming rng has been created beforehand
x = rng.normal(0, size=(3, 4))
y = np.array([np.nan, 0, 1])
TipExercise 4
- Use
count_nonzeroony - Use
isnanonyand count the number of non-NaN values - Check if
xhas at least one positive value in its entirety, by rows and then by columns.
Hint
Take a look at the axis parameter by researching online. For example, here.
4 Manipulating an array
4.1 Manipulation functions
Numpy provides standardized methods or functions for modifying
here’s a table showing some of them:
Here are some functions to modify an array:
| Operation | Implementation |
|---|---|
| Flatten an array | x.flatten() (method) |
| Transpose an array | x.T (method) or np.transpose(x) (function) |
| Append elements to the end | np.append(x, [1,2]) |
| Insert elements at a given position (at positions 1 and 2) | np.insert(x, [1,2], 3) |
| Delete elements (at positions 0 and 3) | np.delete(x, [0,3]) |
To combine arrays, you can use, depending on the case, the functions np.concatenate, np.vstack or the method .r_ (row-wise concatenation). np.hstack or the method .column_stack or .c_ (column-wise concatenation).
x = rng.normal(size = 10)To sort an array, use np.sort
x = np.array([7, 2, 3, 1, 6, 5, 4])

np.sort(x)
array([1, 2, 3, 4, 5, 6, 7])If you want to perform a partial reordering to find the k smallest values in an array without sorting them, use partition:
np.partition(x, 3)array([1, 2, 3, 4, 5, 6, 7])For classical descriptive statistics, Numpy offers a number of already implemented functions, which can be combined with the axis argument.
x = rng.normal(0, size=(3, 4))
TipExercise 5
- Sum all the elements of an
array, the elements by row, and the elements by column. Verify the consistency. - Write a function
statdescto return the following values: mean, median, standard deviation, minimum, and maximum. Apply it toxusing the axis argument.
5 Numerical simulations
Numpy is essential when running random simulations, which is very common in computational statistics with a family of methods known as Monte Carlo methods. The general principle is to replace a difficult theoretical calculation (an integral, a probability, an expectation) with a numerical approximation obtained by repeating a large number of random draws and averaging the quantity of interest, relying on the law of large numbers and the central limit theorem to quantify the accuracy of the estimate.
Let us empirically illustrate a few essential theorems of statistics through a series of exercises. This will allow us to explore:
- The law of large numbers (Tip 5.1);
- The central limit theorem and its particular version in the case of coin tosses, the de Moivre–Laplace theorem;
- Theoretical confidence intervals and their empirical counterpart through the bootstrap;
- The principle of Monte Carlo methods with the rejection algorithm.
We will need the following elements to initialise our data-generating process.
import numpy as np

def generate_grid(size_max=1000):
    n_small = np.arange(3, 200, 2)
    n_log = np.unique(np.round(np.logspace(np.log10(200), np.log10(size_max), 120)).astype(int))
    return np.unique(np.concatenate([n_small, n_log]))

N_max = 100_000
rng = np.random.default_rng(seed=123)
grid = generate_grid(size_max=N_max)
Together, these elements allow us to generate a random series of observations up to a size N_max, and then to observe the evolution of the empirical estimators of moments (mean and variance) when we only keep the first n observations, for different values of n given by grid. The goal is to illustrate the convergence of the empirical estimators to their theoretical values as n increases.
5.1 The law of large numbers
We are used to making the fairly intuitive link between probability theory and statistics. This is made possible in particular thanks to theorems such as the fundamental theorem of statistics (Glivenko–Cantelli theorem). This relationship is the foundation of data science, and more broadly of statistics, in its inferential as well as descriptive dimension, since without formal mathematical intuitions we would struggle to generalise the interpretations drawn from observed data.
The law of large numbers can be illustrated fairly easily through numerical simulations. We will simulate a repeated sequence of random draws, which will be the practical equivalent of the i.i.d. sequence \((X)_i\) of the theorem.
Tip 5.1: Exercise 6: the Law of Large Numbers
Consider an i.i.d. sequence \((X_i)_{i \ge 1}\) such that \(X_i \sim \mathcal{U}\bigl([0,1]\bigr)\).
- Generate a vector
Xof sizeN_maxdrawn from the uniform distribution \(\mathcal{U}\bigl([0,1]\bigr)\). - Plot the histogram of the observed values \(X_i\).
- For each value \(n\) in
grid, compute the empirical quantities associated with the prefix \((X_1,\dots,X_n)\):
| Notation | Name | Formula | Note |
|---|---|---|---|
| \(\bar X_n\) or \(\widehat{\mu}\) | Empirical mean | \(\displaystyle \bar X_n=\frac{1}{n}\sum_{i=1}^{n}X_i\) | Estimates the expectation \(\mathbb{E}[X]=\mu\). |
| \(s_n^2\) | Empirical variance (divisor \(n\)) | \(\displaystyle s_n^2=\frac{1}{n}\sum_{i=1}^{n}(X_i-\bar X_n)^2\) | “Naïve” version (often biased for \(\mathrm{Var}(X)=\sigma^2\)). |
| \(\hat s_n^2\) | Unbiased sample variance (divisor \(n-1\)) | \(\displaystyle \hat s_n^2=\frac{1}{n-1}\sum_{i=1}^{n}(X_i-\bar X_n)^2\) | Unbiased estimator of \(\mathrm{Var}(X)=\sigma^2\) (under i.i.d.). |
- Recall the theoretical values of the mean \(\mu\) and variance \(\sigma^2\) of \(\mathcal{U}\bigl([0,1]\bigr)\), then compare the empirical quantities to these values graphically.
- At what rate does the empirical mean \(\bar X_n\) converge to \(\mu\)? Propose a graphical illustration (for instance, plot \(|\bar X_n-\mu|\) as a function of \(n\) and compare it to a \(1/\sqrt{n}\) decay, or plot \(\sqrt{n}\,|\bar X_n-\mu|\)).
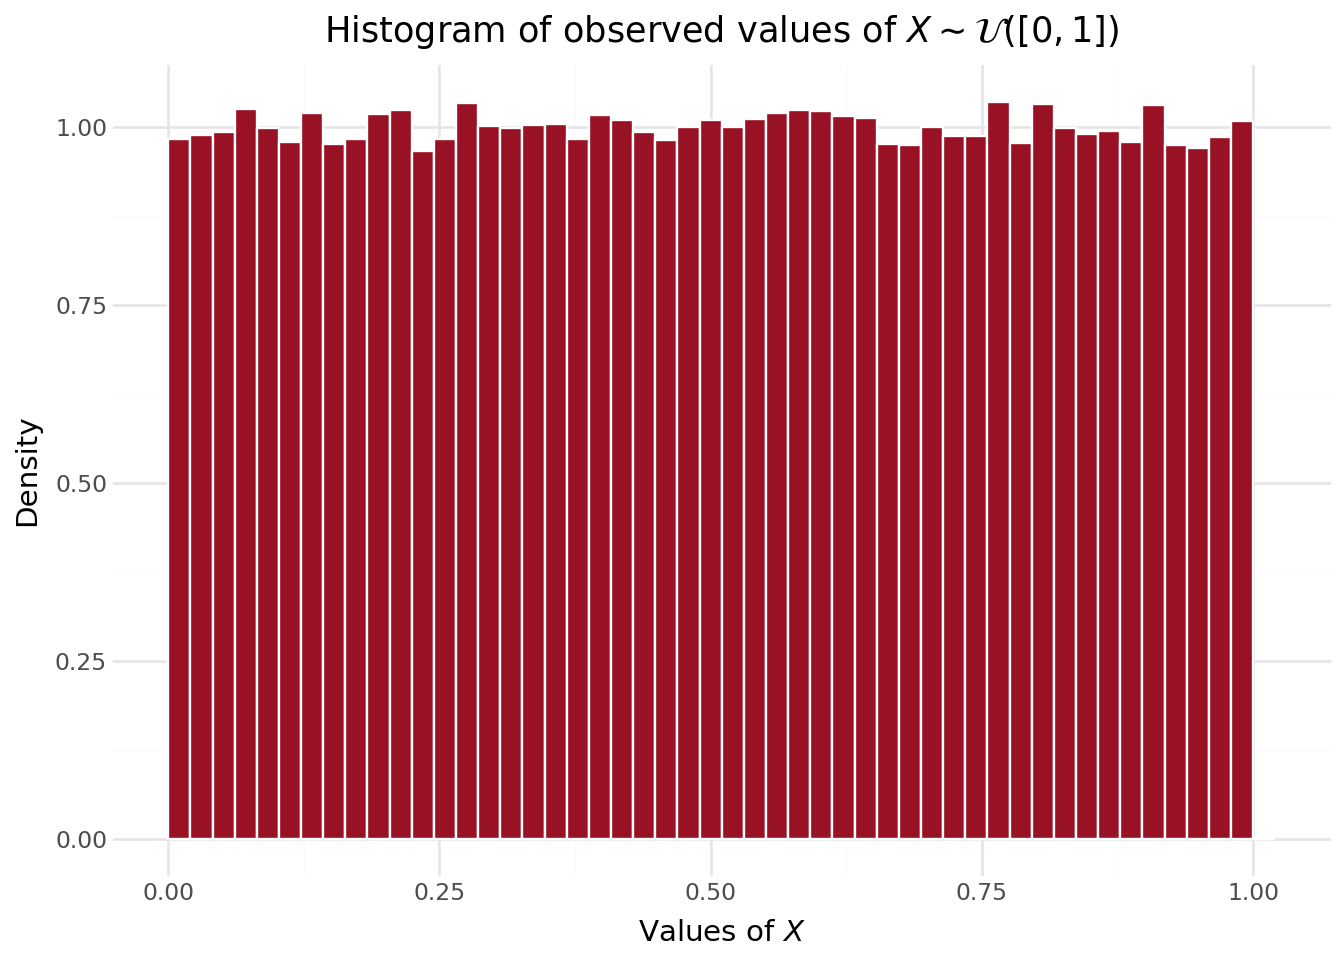
The empirical density from our large sample clearly shows an almost even spread of values (Figure 5.1). Our empirical distribution is not perfectly uniform, but it is visually quite close. Before studying the distribution in more detail, which is the focus of the next exercises, we can already check the moments of our sample, namely the empirical mean and the empirical variance.
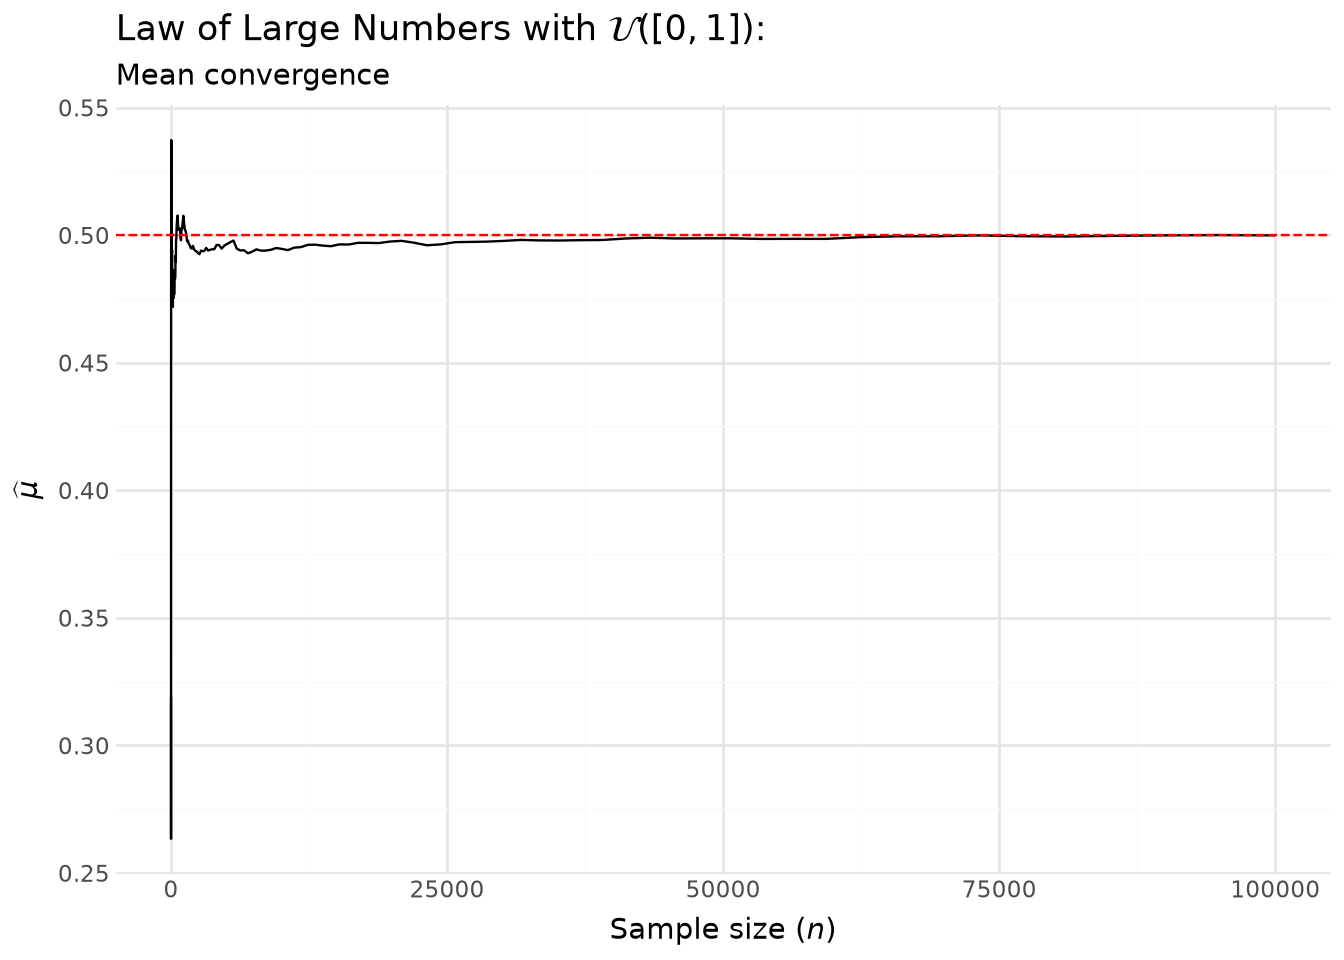
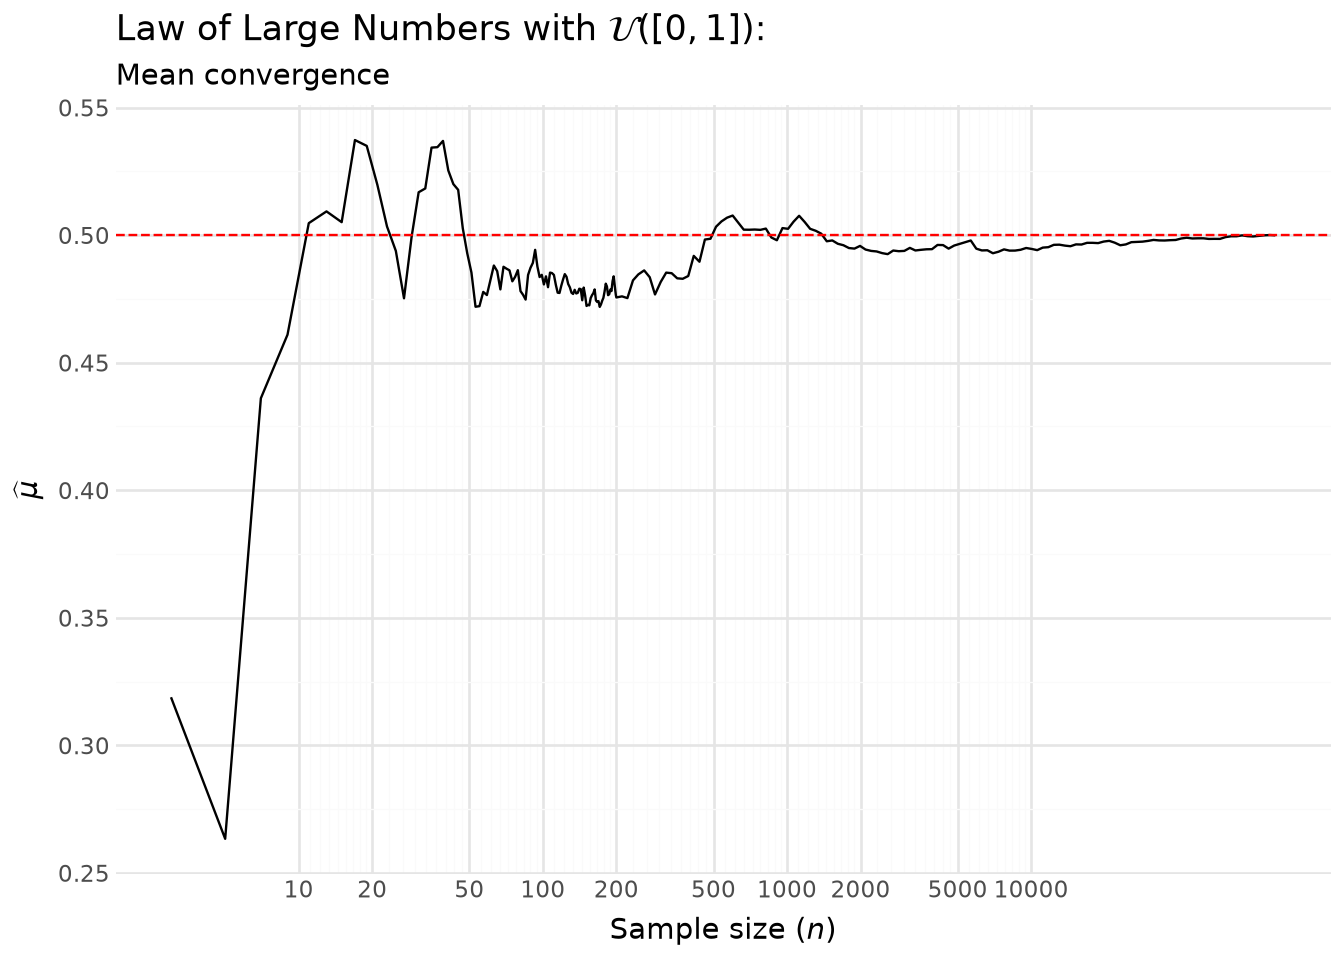
With Figure 5.2, we can see the empirical mean converging to its theoretical value (the expectation).
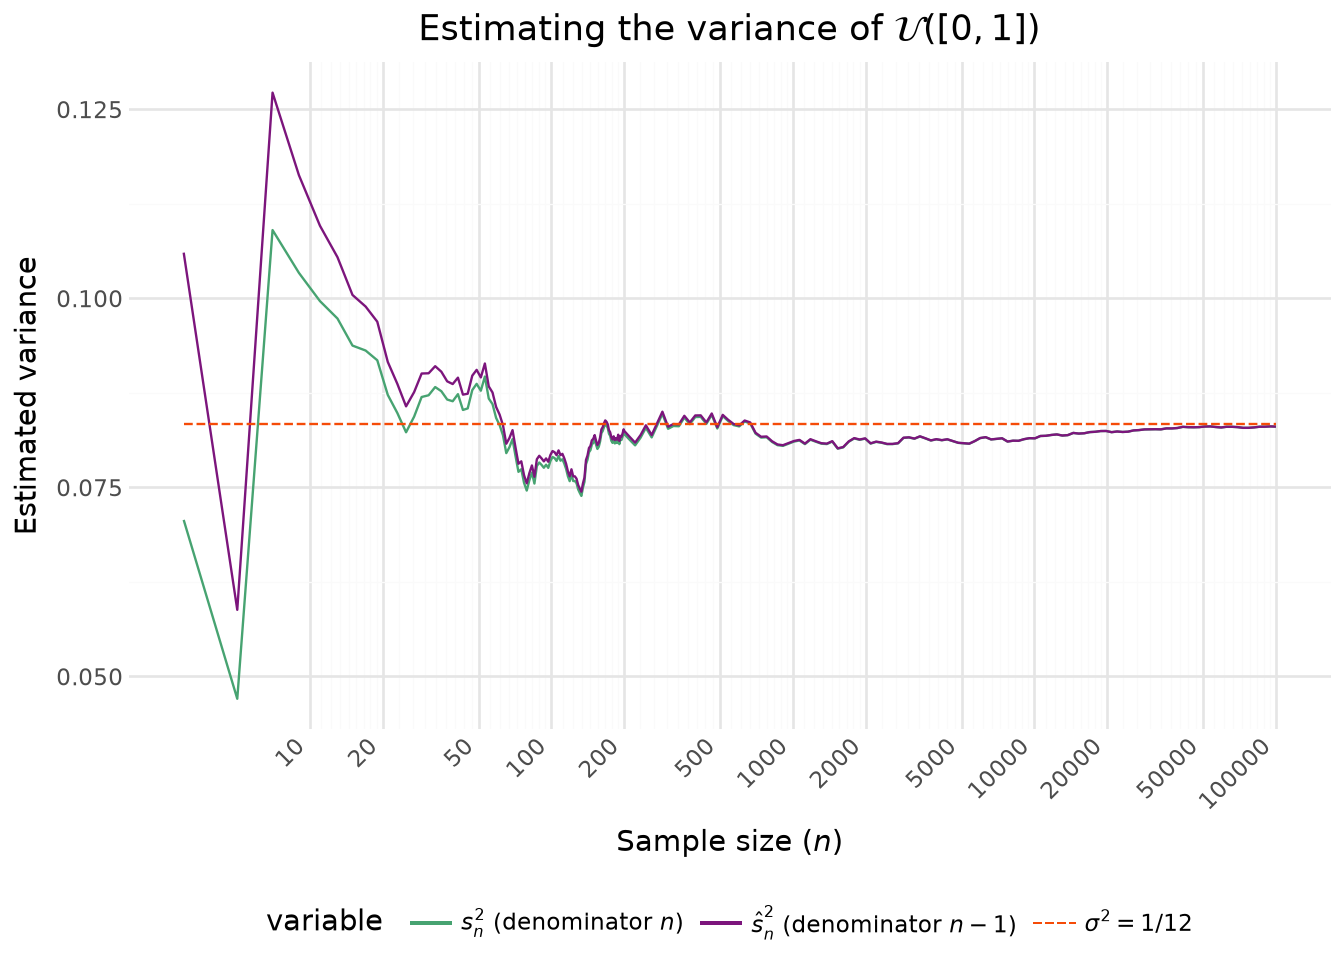
With Figure 5.3 we can see that the intuitive version of the empirical variance, that is, the one with \(n\) in the denominator, systematically tends to underestimate the variance. It is indeed a biased estimator, even though the bias tends to 0 as \(n\) grows. The sample variance, the one with \(n-1\), follows broadly the same dynamics but gets closer to the theoretical value sooner.
/__w/python-datascientist/python-datascientist/.venv/lib/python3.13/site-packages/plotnine/geoms/geom_path.py:100: PlotnineWarning: geom_path: Removed 115 rows containing missing values.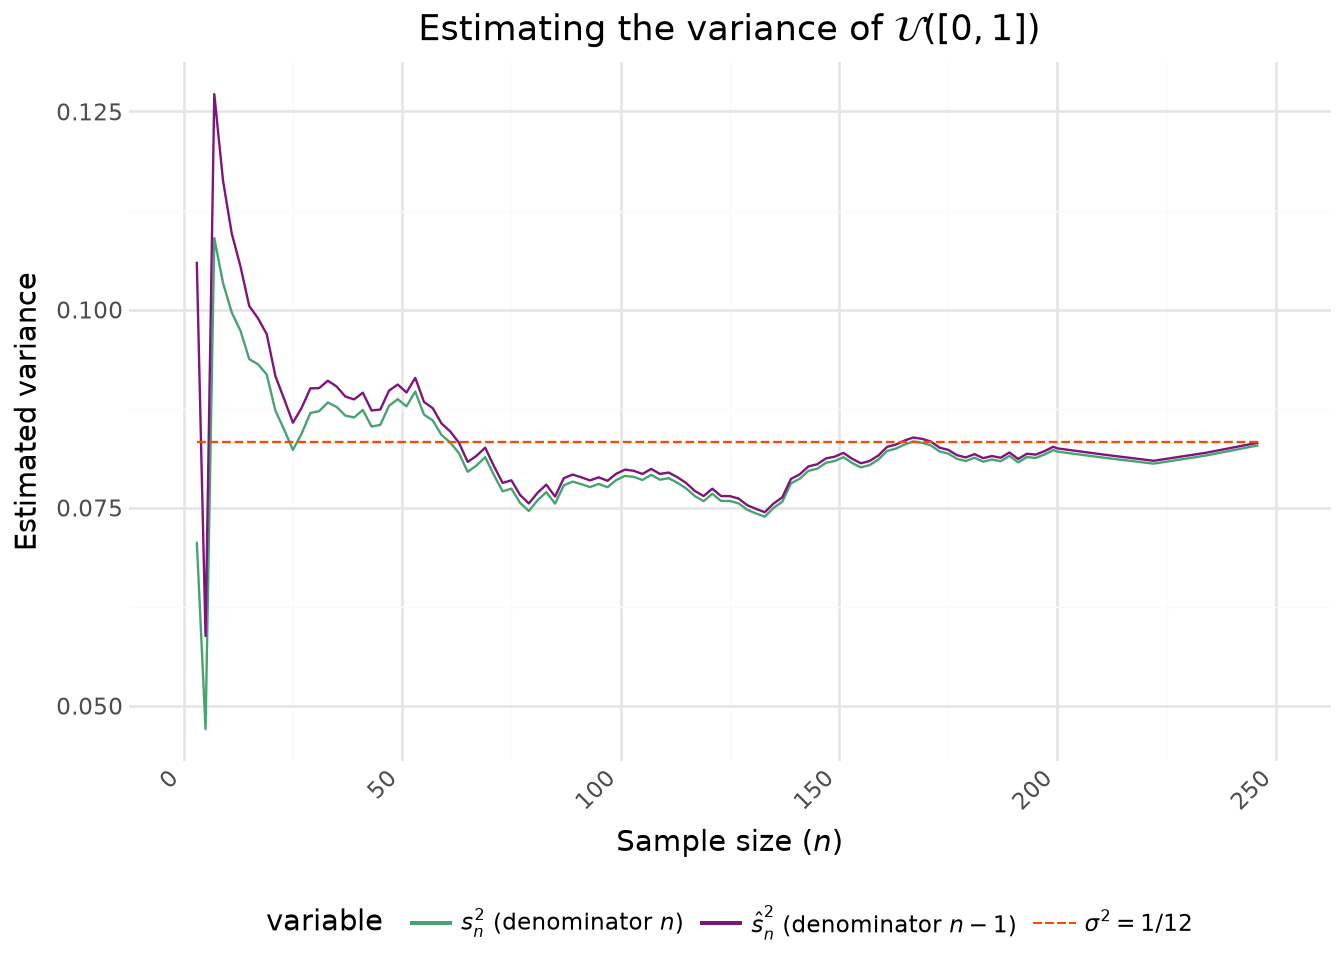
Let us look at the absolute difference between \(\mu\) and \(\widehat{\mu}\) to try to determine the convergence rate. We will do this for the first values, i.e. before the estimation error becomes negligible.
/__w/python-datascientist/python-datascientist/.venv/lib/python3.13/site-packages/plotnine/geoms/geom_path.py:100: PlotnineWarning: geom_path: Removed 170 rows containing missing values.
/__w/python-datascientist/python-datascientist/.venv/lib/python3.13/site-packages/plotnine/geoms/geom_path.py:100: PlotnineWarning: geom_path: Removed 170 rows containing missing values.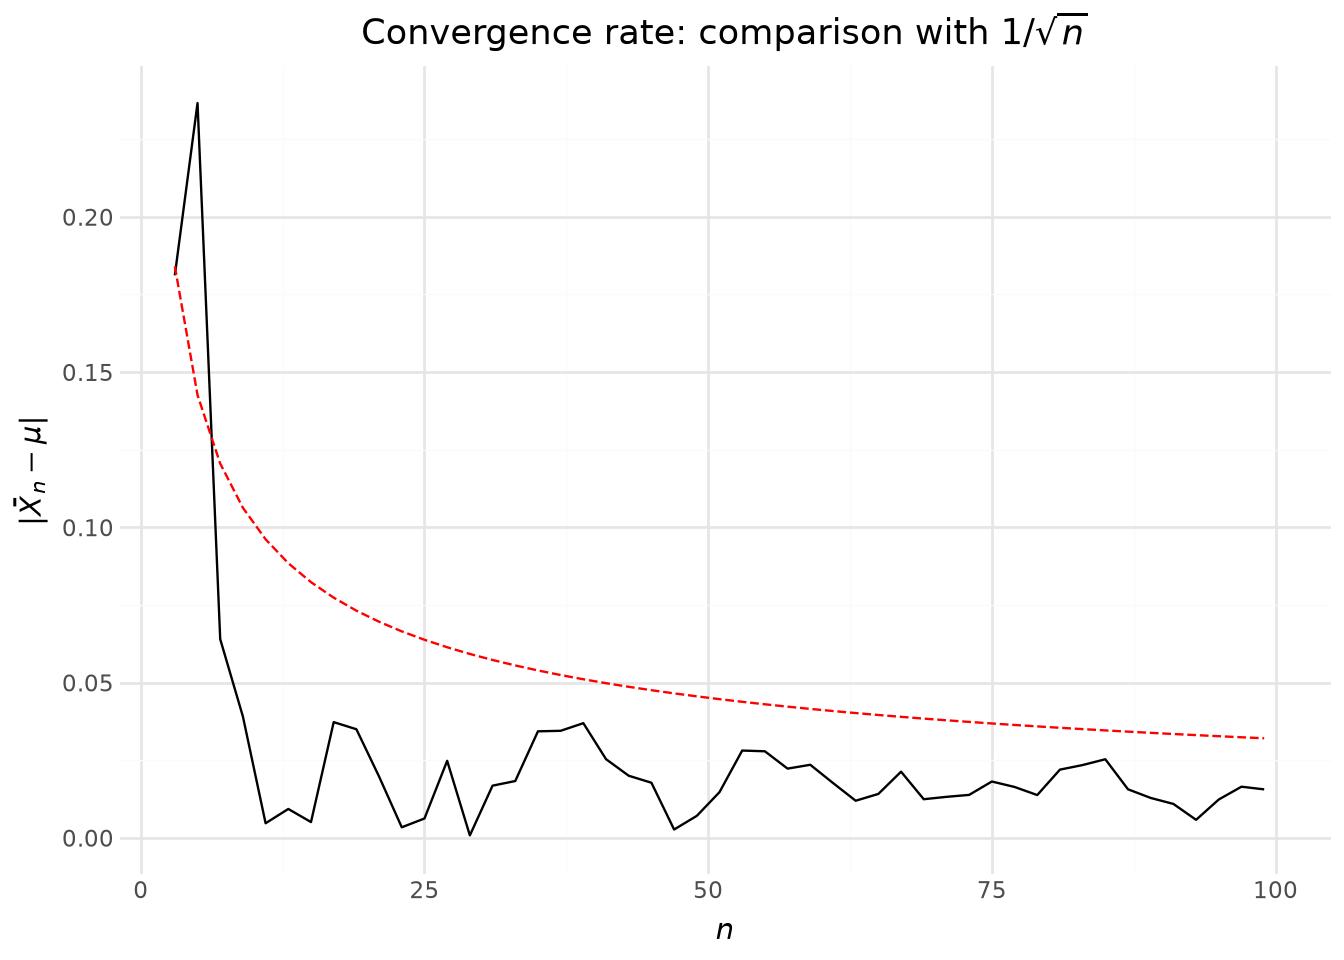
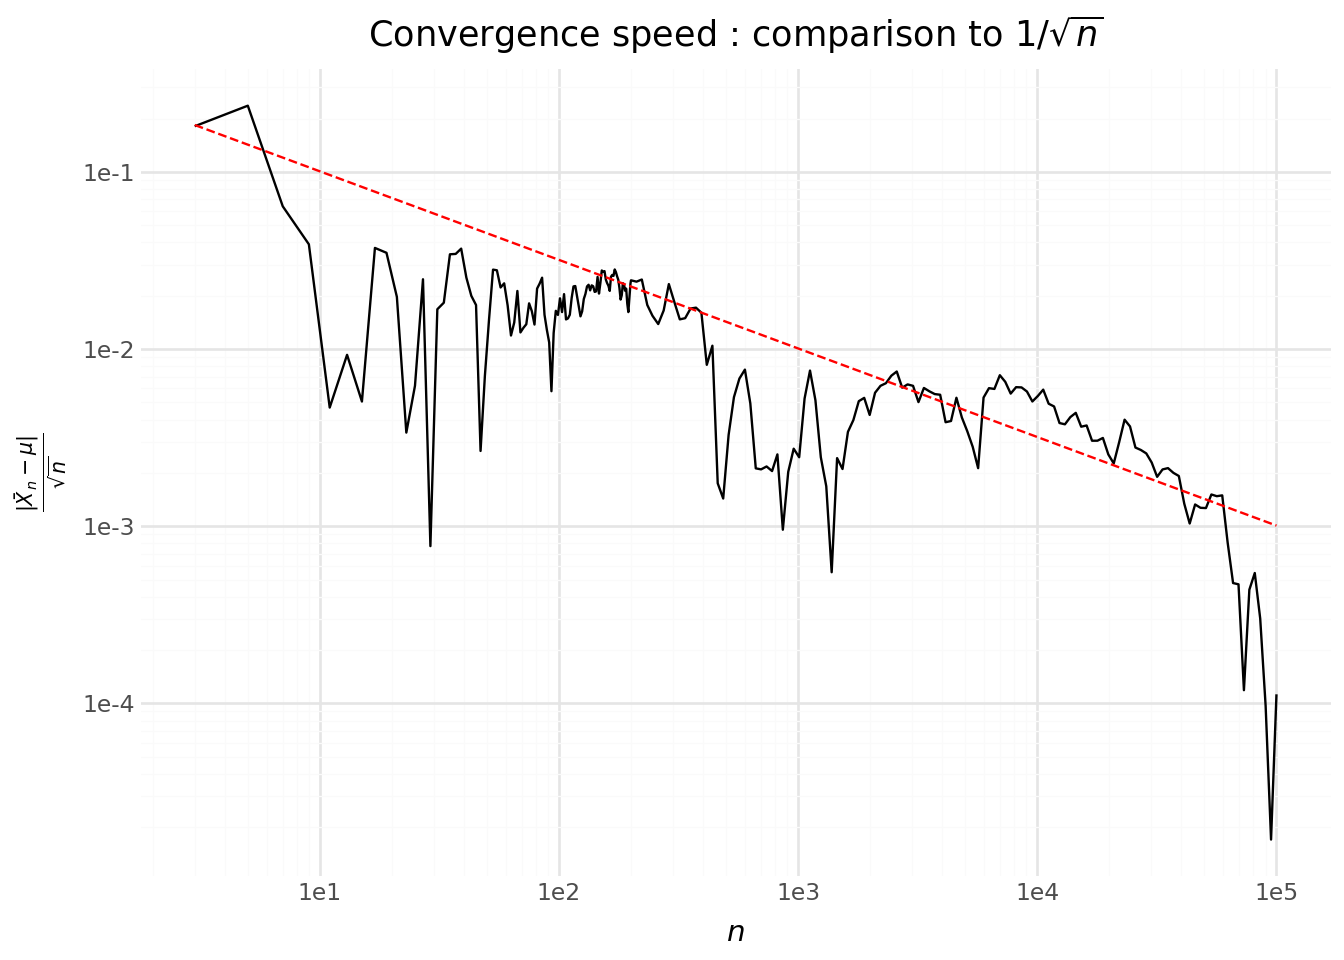
This looks like a hyperbola of the form \(1/\sqrt{n}\). Let us check whether this is consistent by plotting \(\sqrt{n}\,|\bar X_n - \mu|\). If we look beyond the very first values and plot the rescaled estimation error (Figure 5.4), we see that the previous intuition was correct: the estimation error (after scaling by \(\sqrt{n}\)) oscillates around a roughly constant level.
5.2 Distribution of coin-toss results
TipExercise 6, part 2. De Moivre–Laplace (binomial)
Consider an i.i.d. sequence \((X_i)_{i \ge 1}\) such that \(X_i \sim \mathcal{B}(100,1/2)\) (number of heads in 100 tosses of a fair coin).
- Plot the distribution of \(X_1\) (probability mass function): \(k \mapsto \mathbb{P}(X_1=k)\) for \(k \in \{0,\dots,100\}\).
- Compute the mean \(\mu=\mathbb{E}[X_1]\) and the variance \(\sigma^2=\mathrm{Var}(X_1)\). Give their numerical values.
- For a value \(N\) (for example \(N \in \{50,200,1000,5000\}\)), generate i.i.d. \(X_1,\dots,X_N\) and compute \(\bar X_N = \frac{1}{N}\sum_{i=1}^N X_i\).
- By repeating the experiment a large number of times, plot the empirical distribution of \[ Y_N = \sqrt{N}\,(\bar X_N-\mu). \]
- On the same figure, superimpose the density of the normal distribution \(\mathcal{N}(0,\sigma^2)\). In this case, you should get \(\sigma^2=25\).
TipExercise 6, part 3. CLT for other distributions (finite variance)
Choose a distribution among: Poisson, exponential, uniform (your choice), specifying its parameters. Consider an i.i.d. sequence \((X_i)_{i \ge 1}\) following this distribution, with mean \(\mu\) and variance \(\sigma^2\) (both finite).
- Give (or compute) \(\mu\) and \(\sigma^2\) for the chosen distribution.
- For several values of \(N\), by repeating the experiment a large number of times, plot the empirical distribution of \[ Y_N = \sqrt{N}\,(\bar X_N-\mu) \] and compare it to the density of the normal distribution \(\mathcal{N}(0,\sigma^2)\).
- Optional: also study the standardised version \[ Z_N = \sqrt{N}\,\frac{\bar X_N-\mu}{\sigma} \] and compare it to \(\mathcal{N}(0,1)\).
TipExercise 6, part 4. Counterexample: the Cauchy distribution
Now consider an i.i.d. sequence \((X_i)_{i \ge 1}\) following a standard Cauchy distribution.
- Generate a vector
Xof sizeN_maxfollowing a standard Cauchy distribution. - For each value \(n\) of
grid, compute the empirical mean \(\bar X_n = \frac{1}{n}\sum_{i=1}^n X_i\) and plot \(\bar X_n\) as a function of \(n\). - Does the observed behaviour look like convergence to a constant? Compare qualitatively with part 1.
- Do the “classical” LLN and CLT apply here? Justify by discussing the existence (or not) of \(\mu\) and \(\sigma^2\).
6 Broadcasting
Broadcasting refers to a set of rules for applying operations to arrays of different dimensions. In practice, it generally consists of applying a single operation to all members of a numpy array.
The difference can be understood from the following example. Broadcasting allows the scalar 5 to be transformed into a 3-dimensional array:
a = np.array([0, 1, 2])
b = np.array([5, 5, 5])

a + b
a + 5
array([5, 6, 7])Broadcasting can be very practical for efficiently performing operations on data with a complex structure. For more details, visit here or here.
6.1 Application: programming your own k-nearest neighbors
TipExercise 6 (a bit more challenging)
- Create
X, a two-dimensional array (i.e., a matrix) with 10 rows and 2 columns. The numbers in the array are random. - Import the
matplotlib.pyplotmodule asplt. Useplt.scatterto plot the data as a scatter plot. - Construct a 10x10 matrix storing, at element \((i,j)\), the Euclidean distance between points \(X[i,]\) and \(X[j,]\). To do this, you will need to work with dimensions by creating nested arrays using
np.newaxis:- First, use
X1 = X[:, np.newaxis, :]to transform the matrix into a nested array. Check the dimensions. - Create
X2of dimension(1, 10, 2)using the same logic. - Deduce, for each point, the distance with other points for each coordinate. Square this distance.
- At this stage, you should have an array of dimension
(10, 10, 2). The reduction to a matrix is obtained by summing over the last axis. Check the help ofnp.sumon how to sum over the last axis. - Finally, apply the square root to obtain a proper Euclidean distance.
- First, use
- Verify that the diagonal elements are zero (distance of a point to itself…).
- Now, sort for each point the points with the most similar values. Use
np.argsortto get the ranking of the closest points for each row. - We are interested in the k-nearest neighbors. For now, set k=2. Use
argpartitionto reorder each row so that the 2 closest neighbors of each point come first, followed by the rest of the row. - Use the code snippet below to graphically represent the nearest neighbors.
A hint for graphically representing the nearest neighbors
plt.scatter(X[:, 0], X[:, 1], s=100)

# draw lines from each point to its two nearest neighbors
K = 2

for i in range(X.shape[0]):
    for j in nearest_partition[i, :K+1]:
        # plot a line from X[i] to X[j]
        # use some zip magic to make it happen:
        plt.plot(*zip(X[j], X[i]), color='black')
For question 2, you should get a graph that looks like this:
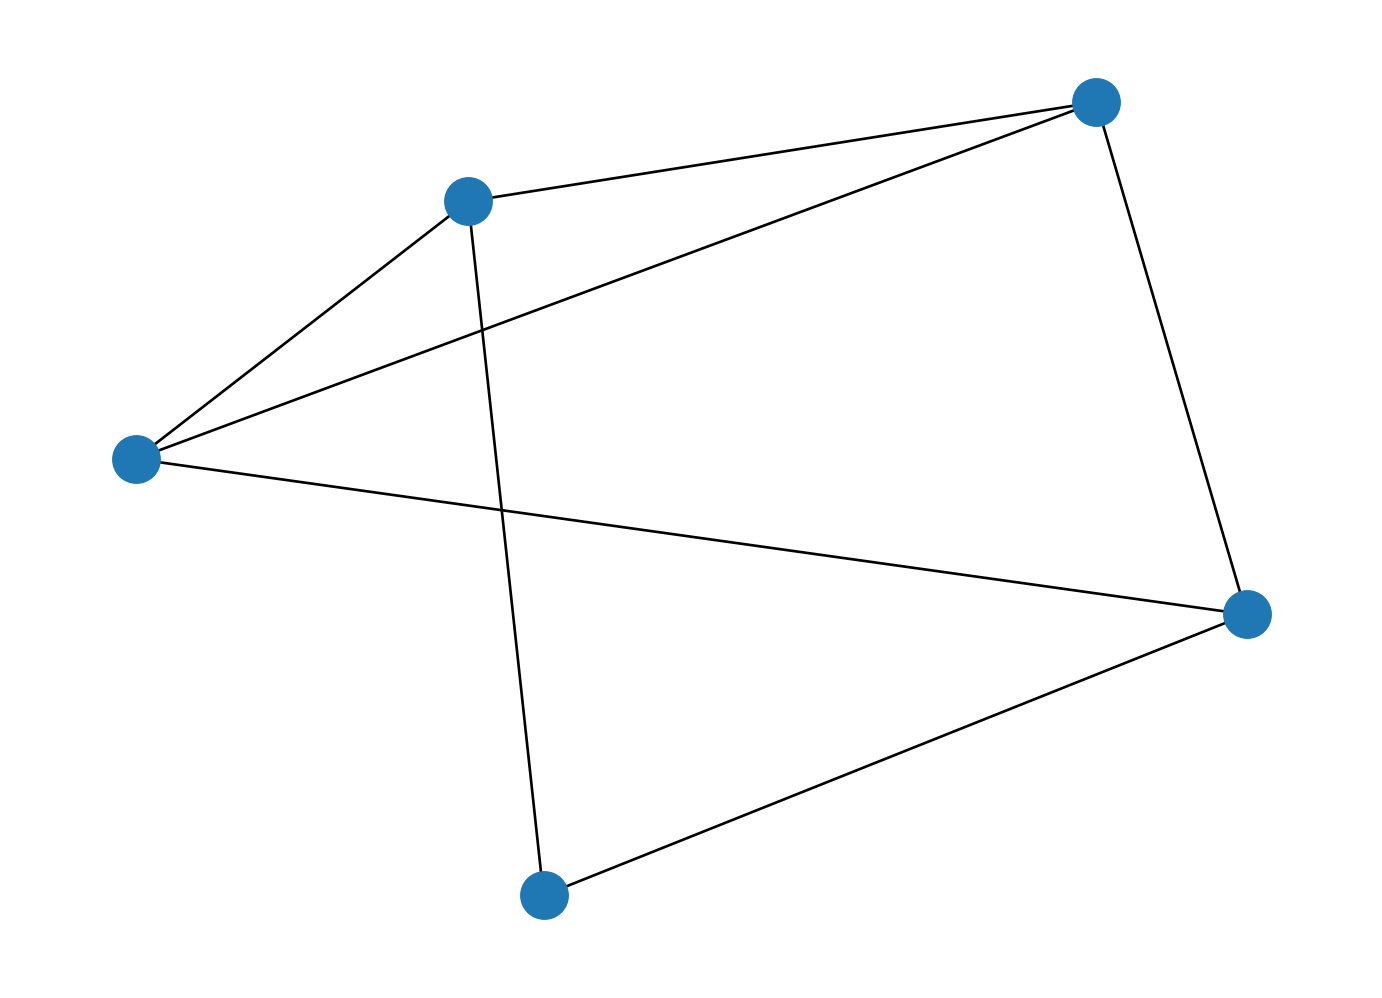
Question 7 result is :
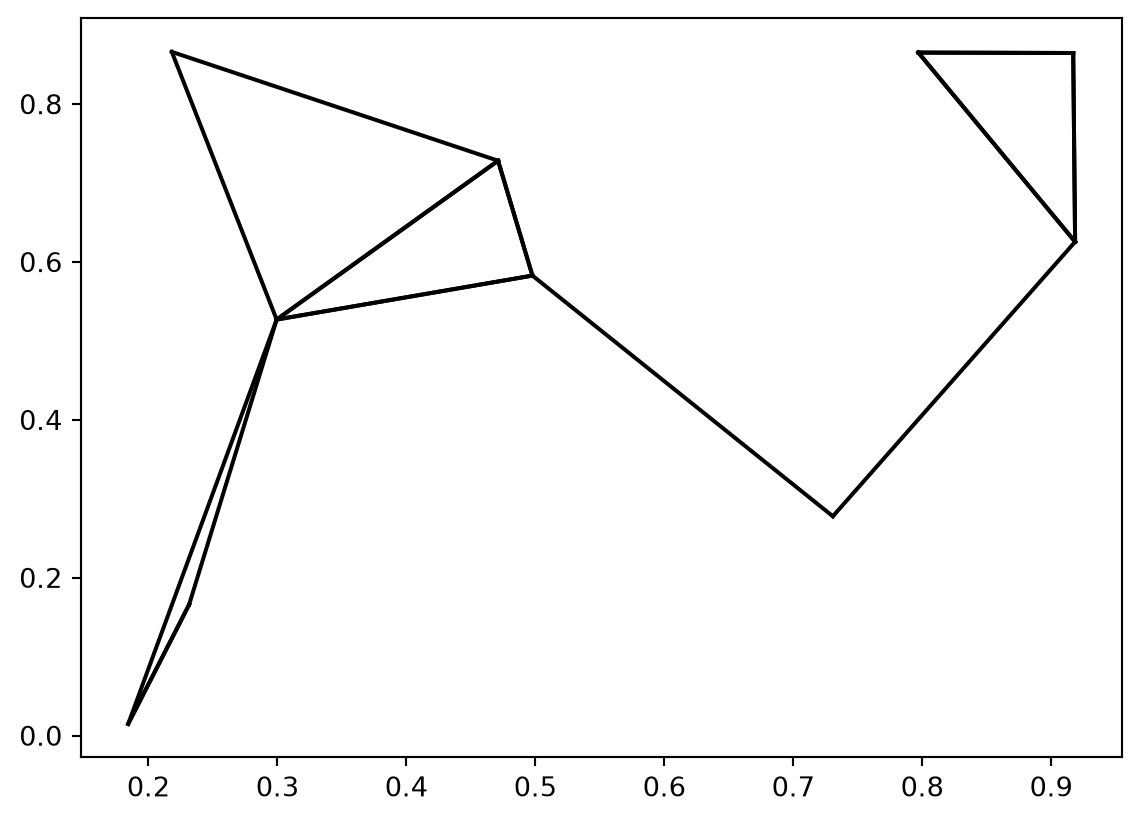
Did I invent this challenging exercise? Not at all, it comes from the book Python Data Science Handbook. But if I had told you this immediately, would you have tried to answer the questions?
Moreover, it would not be a good idea to generalize this algorithm to large datasets. The complexity of our approach is \(O(N^2)\). The algorithm implemented by Scikit-Learn is \(O[NlogN]\).
Additionally, computing matrix distances using the power of GPU (graphics cards) would be faster. In this regard, the library faiss, or the dedicated frameworks for computing distance between high-dimensional vectors like ChromaDB offer much more satisfactory performance than Numpy for this specific problem.
7 Additional Exercises
TipUnderstanding the PageRank Algorithm
Google became famous thanks to its PageRank algorithm. This algorithm allows, from links between websites, to give an importance score to a website which will be used to evaluate its centrality in a network. The objective of this exercise is to use Numpy to implement such an algorithm from an adjacency matrix that links the sites together.
- Create the following matrix with
numpy. Call itM:
\[ \begin{bmatrix} 0 & 0 & 0 & 0 & 1 \\ 0.5 & 0 & 0 & 0 & 0 \\ 0.5 & 0 & 0 & 0 & 0 \\ 0 & 1 & 0.5 & 0 & 0 \\ 0 & 0 & 0.5 & 1 & 0 \end{bmatrix} \]
- To visually represent this minimalist web, convert it into a
networkxobject (a library specialized in network analysis) and use thedrawfunction of this package.
It is the transpose of the adjacency matrix that allows linking the sites together. For example, site 1 (first column) is referenced by sites 2 and 3. It only references site 5.
- From the English Wikipedia page of
PageRank, test on your matrix.
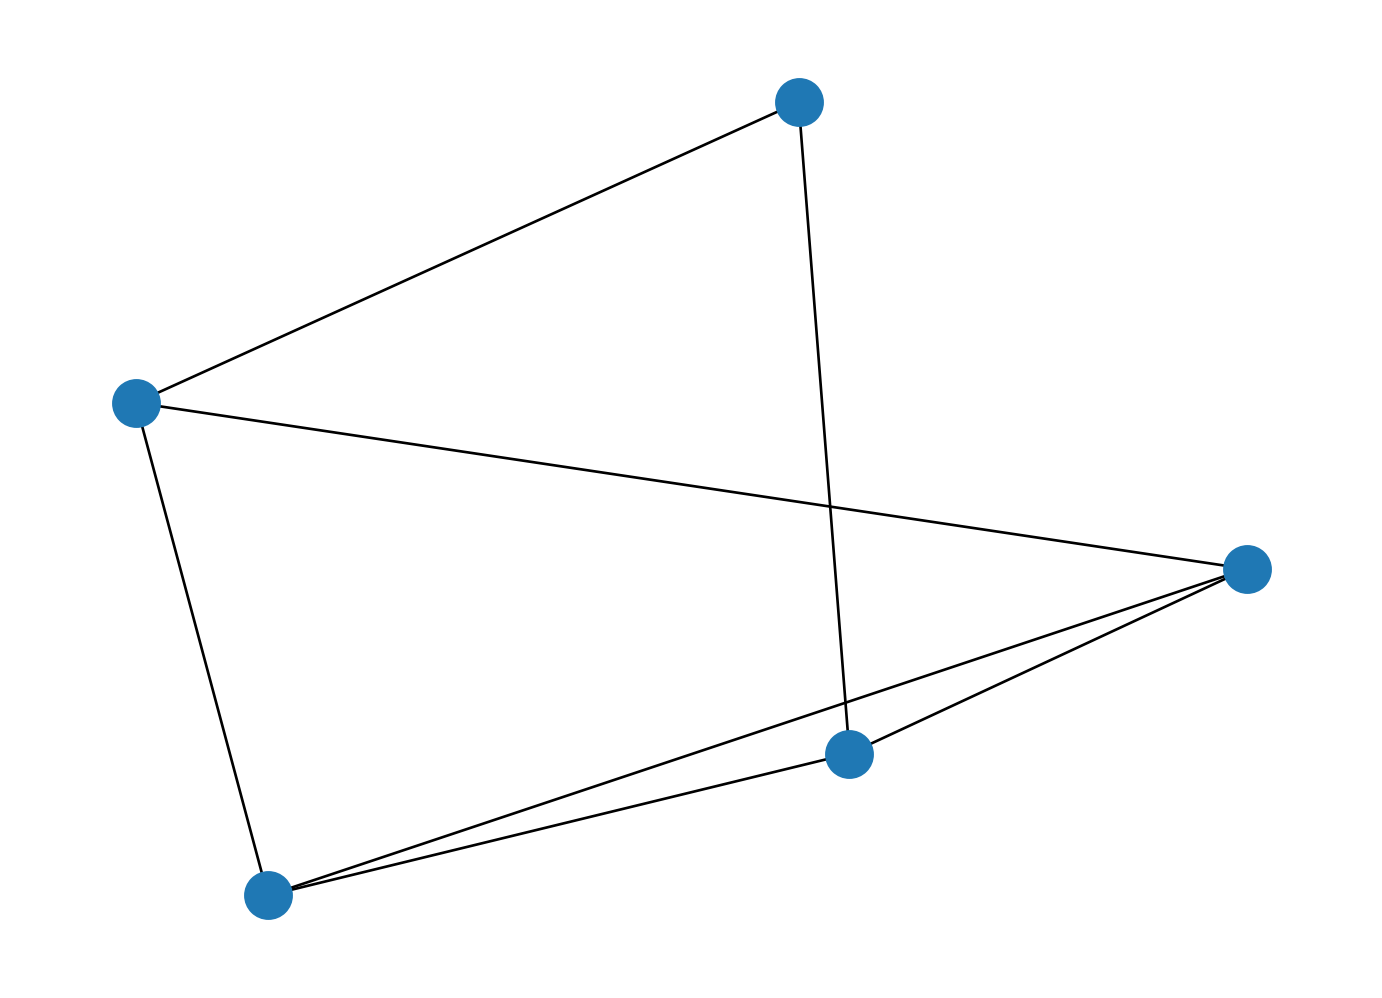
Site 1 is quite central because it is referenced twice. Site 5 is also central since it is referenced by site 1.
array([[0.25419178],
       [0.13803151],
       [0.13803151],
       [0.20599017],
       [0.26375504]])
Informations additionnelles
NotePython environment
This site was built automatically through a Github action using the Quarto
The environment used to obtain the results is reproducible via uv. The pyproject.toml file used to build this environment is available on the linogaliana/python-datascientist repository
pyproject.toml
[project]
name = "python-datascientist"
version = "0.1.0"
description = "Source code for Lino Galiana's Python for data science course"
readme = "README.md"
requires-python = ">=3.13,<3.14"
dependencies = [
    "altair>=6.0.0",
    "cartiflette>=0.2",
    "contextily==1.6.2",
    "duckdb>=0.10.1",
    "folium>=0.19.6",
    "gdal==3.11.4",
    "graphviz==0.20.3",
    "great-tables>=0.12.0",
    "gt-extras>=0.0.8",
    "ipykernel>=6.29.5",
    "jupyter>=1.1.1",
    "jupyter-cache>=1.0.0",
    "kaleido>=0.2.1",
    "langchain-community>=0.3.27",
    "loguru==0.7.3",
    "markdown>=3.8",
    "nbclient>=0.10.0",
    "nbformat>=5.10.4",
    "nltk>=3.9.1",
    "openpyxl>=3.1.5",
    "pandas>=3.0",
    "pip>=25.1.1",
    "plotly>=6.1.2",
    "plotnine>=0.15",
    "polars>=1.8.2",
    "py7zr>=1.1.3",
    "pyarrow>=17.0.0",
    "pynsee>=0.1.8",
    "python-dotenv>=1.0.1",
    "python-frontmatter>=1.1.0",
    "pywaffle>=1.1.1",
    "requests>=2.32.3",
    "scikit-image>=0.24.0",
    "scikit-learn>=1.8.0",
    "scipy>=1.13.0",
    "seaborn>=0.13.2",
    "selenium<4.39.0",
    "spacy>=3.8.4",
    "webdriver-manager>=4.0.2",
    "wordcloud==1.9.3",
]

[tool.uv.sources]
gdal = [
  { index = "gdal-wheels", marker = "sys_platform == 'linux'" },
  { index = "geospatial_wheels", marker = "sys_platform == 'win32'" },
]

[[tool.uv.index]]
name = "geospatial_wheels"
url = "https://nathanjmcdougall.github.io/geospatial-wheels-index/"
explicit = true

[[tool.uv.index]]
name = "gdal-wheels"
url = "https://gitlab.com/api/v4/projects/61637378/packages/pypi/simple"
explicit = true

[dependency-groups]
dev = [
    "nb-clean>=4.0.1",
]
To use exactly the same environment (version of Python and packages), please refer to the documentation for uv.
NoteFile history
| SHA | Date | Author | Description |
|---|---|---|---|
| 345804e7 | 2026-09-26 09:17:19 | Lino Galiana | Création d’un PDF avec typst (#703) |
| 40bd4299 | 2026-09-20 12:45:39 | linogaliana | Correction en masse des problèmes de traduction |
| af3dc004 | 2026-07-16 15:27:09 | linogaliana | problem with nested divs in numpy chapter |
| 56a7f816 | 2026-03-09 16:33:26 | lgaliana | fix wrong label cross ref |
| 5f7df3c4 | 2026-01-11 21:56:28 | Lino Galiana | Exercice loi des grands nombres avec Numpy (#673) |
| ff5f896b | 2025-10-03 14:10:58 | lgaliana | Affiche la correction de l’exo 4 numpy |
| 6d37e77a | 2025-09-23 22:58:21 | Lino Galiana | Correction des problèmes du notebook Pandas (#653) |
| 794ce14a | 2025-09-15 16:21:42 | lgaliana | retouche quelques abstracts |
| eeb949c8 | 2025-08-21 17:38:40 | Lino Galiana | Fix a few problems detected by AI agent (#641) |
| 1884aef7 | 2025-07-28 13:47:11 | lgaliana | Teste une extension différente |
| 7006f605 | 2025-07-28 14:20:47 | Lino Galiana | Une première PR qui gère plein de bugs détectés par Nicolas (#630) |
| 94648290 | 2025-07-22 18:57:48 | Lino Galiana | Fix boxes now that it is better supported by jupyter (#628) |
| 91431fa2 | 2025-06-09 17:08:00 | Lino Galiana | Improve homepage hero banner (#612) |
| 488780a4 | 2024-09-25 14:32:16 | Lino Galiana | Change badge (#556) |
| 4640e6da | 2024-09-18 11:53:05 | linogaliana | corrections |
| 88b030e8 | 2024-08-08 17:45:56 | Lino Galiana | Replace by English metadata when relevant (#535) |
| 580cba77 | 2024-08-07 18:59:35 | Lino Galiana | Multilingual version as quarto profile (#533) |
| 72f42bb7 | 2024-07-25 19:06:38 | Lino Galiana | Language message on notebooks (#529) |
| 195dc9e9 | 2024-07-25 11:59:19 | linogaliana | Switch language button |
| 6bf883d9 | 2024-07-08 15:09:21 | Lino Galiana | Rename files (#518) |
| 56b6442d | 2024-07-08 15:05:57 | Lino Galiana | Version anglaise du chapitre numpy (#516) |
| 065b0abd | 2024-07-08 11:19:43 | Lino Galiana | Nouveaux callout dans la partie manipulation (#513) |
| d75641d7 | 2024-04-22 18:59:01 | Lino Galiana | Editorialisation des chapitres de manipulation de données (#491) |
| 005d89b8 | 2023-12-20 17:23:04 | Lino Galiana | Finalise l’affichage des statistiques Git (#478) |
| 16842200 | 2023-12-02 12:06:40 | Antoine Palazzolo | Première partie de relecture de fin du cours (#467) |
| 1f23de28 | 2023-12-01 17:25:36 | Lino Galiana | Stockage des images sur S3 (#466) |
| a06a2689 | 2023-11-23 18:23:28 | Antoine Palazzolo | 2ème relectures chapitres ML (#457) |
| 889a71ba | 2023-11-10 11:40:51 | Antoine Palazzolo | Modification TP 3 (#443) |
| a7711832 | 2023-10-09 11:27:45 | Antoine Palazzolo | Relecture TD2 par Antoine (#418) |
| a63319ad | 2023-10-04 15:29:04 | Lino Galiana | Correction du TP numpy (#419) |
| e8d0062d | 2023-09-26 15:54:49 | Kim A | Relecture KA 25/09/2023 (#412) |
| 154f09e4 | 2023-09-26 14:59:11 | Antoine Palazzolo | Des typos corrigées par Antoine (#411) |
| a8f90c2f | 2023-08-28 09:26:12 | Lino Galiana | Update featured paths (#396) |
| 80823022 | 2023-08-25 17:48:36 | Lino Galiana | Mise à jour des scripts de construction des notebooks (#395) |
| 3bdf3b06 | 2023-08-25 11:23:02 | Lino Galiana | Simplification de la structure 🤓 (#393) |
| 9e1e6e41 | 2023-07-20 02:27:22 | Lino Galiana | Change launch script (#379) |
| 130ed717 | 2023-07-18 19:37:11 | Lino Galiana | Restructure les titres (#374) |
| ef28fefd | 2023-07-07 08:14:42 | Lino Galiana | Listing pour la première partie (#369) |
| f21a24d3 | 2023-07-02 10:58:15 | Lino Galiana | Pipeline Quarto & Pages 🚀 (#365) |
| 7e15843a | 2023-02-13 18:57:28 | Lino Galiana | from_numpy_array no longer in networkx 3.0 (#353) |
| a408cc96 | 2023-02-01 09:07:27 | Lino Galiana | Ajoute bouton suggérer modification (#347) |
| 3c880d59 | 2022-12-27 17:34:59 | Lino Galiana | Chapitre regex + Change les boites dans plusieurs chapitres (#339) |
| e2b53ac9 | 2022-09-28 17:09:31 | Lino Galiana | Retouche les chapitres pandas (#287) |
| d068cb6d | 2022-09-24 14:58:07 | Lino Galiana | Corrections avec echo true (#279) |
| b2d48237 | 2022-09-21 17:36:29 | Lino Galiana | Relec KA 21/09 (#273) |
| a56dd451 | 2022-09-20 15:27:56 | Lino Galiana | Fix SSPCloud links (#270) |
| f10815b5 | 2022-08-25 16:00:03 | Lino Galiana | Notebooks should now look more beautiful (#260) |
| 494a85ae | 2022-08-05 14:49:56 | Lino Galiana | Images featured ✨ (#252) |
| d201e3cd | 2022-08-03 15:50:34 | Lino Galiana | Pimp la homepage ✨ (#249) |
| 1ca1a8a7 | 2022-05-31 11:44:23 | Lino Galiana | Retour du chapitre API (#228) |
| 4fc58e52 | 2022-05-25 18:29:25 | Lino Galiana | Change deployment on SSP Cloud with new filesystem organization (#227) |
| 12965bac | 2022-05-25 15:53:27 | Lino Galiana | :launch: Bascule vers quarto (#226) |
| 9c71d6e7 | 2022-03-08 10:34:26 | Lino Galiana | Plus d’éléments sur S3 (#218) |
| 6777f038 | 2021-10-29 09:38:09 | Lino Galiana | Notebooks corrections (#171) |
| 2a8809fb | 2021-10-27 12:05:34 | Lino Galiana | Simplification des hooks pour gagner en flexibilité et clarté (#166) |
| 26ea709d | 2021-09-27 19:11:00 | Lino Galiana | Règle quelques problèmes np (#154) |
| 2fa78c9f | 2021-09-27 11:24:19 | Lino Galiana | Relecture de la partie numpy/pandas (#152) |
| 85ba1194 | 2021-09-16 11:27:56 | Lino Galiana | Relectures des TP KA avant 1er cours (#142) |
| 2e4d5862 | 2021-09-02 12:03:39 | Lino Galiana | Simplify badges generation (#130) |
| 2f7b52d9 | 2021-07-20 17:37:03 | Lino Galiana | Improve notebooks automatic creation (#120) |
| 80877d20 | 2021-06-28 11:34:24 | Lino Galiana | Ajout d’un exercice de NLP à partir openfood database (#98) |
| 6729a724 | 2021-06-22 18:07:05 | Lino Galiana | Mise à jour badge onyxia (#115) |
| 4cdb759c | 2021-05-12 10:37:23 | Lino Galiana | :sparkles: :star2: Nouveau thème hugo :snake: :fire: (#105) |
| 7f9f97bc | 2021-04-30 21:44:04 | Lino Galiana | 🐳 + 🐍 New workflow (docker 🐳) and new dataset for modelization (2020 🇺🇸 elections) (#99) |
| 0a0d0348 | 2021-03-26 20:16:22 | Lino Galiana | Ajout d’une section sur S3 (#97) |
| 6d010fa2 | 2020-09-29 18:45:34 | Lino Galiana | Simplifie l’arborescence du site, partie 1 (#57) |
| 66f9f87a | 2020-09-24 19:23:04 | Lino Galiana | Introduction des figures générées par python dans le site (#52) |
| edca3916 | 2020-09-21 19:31:02 | Lino Galiana | Change np.is_nan to np.isnan |
| f9f00cc0 | 2020-09-15 21:05:54 | Lino Galiana | enlève quelques TO DO |
| 4677769b | 2020-09-15 18:19:24 | Lino Galiana | Nettoyage des coquilles pour premiers TP (#37) |
| d48e68fa | 2020-09-08 18:35:07 | Lino Galiana | Continuer la partie pandas (#13) |
| 913047d3 | 2020-09-08 14:44:41 | Lino Galiana | Harmonisation des niveaux de titre (#17) |
| c452b832 | 2020-07-28 17:32:06 | Lino Galiana | TP Numpy (#9) |
| 200b6c1f | 2020-07-27 12:50:33 | Lino Galiana | Encore une coquille |
| 5041b280 | 2020-07-27 12:44:10 | Lino Galiana | Une coquille à cause d’un bloc jupyter |
| e8db4cf0 | 2020-07-24 12:56:38 | Lino Galiana | modif des markdown |
| b24a1fe7 | 2020-07-23 18:20:09 | Lino Galiana | Add notebook |
| 4f8f1caa | 2020-07-23 18:19:28 | Lino Galiana | fix typo |
| 434d20e8 | 2020-07-23 18:18:46 | Lino Galiana | Essai de yaml header |
| 5ac02efd | 2020-07-23 18:05:12 | Lino Galiana | Essai de md généré avec jupytext |
Citation
BibTeX citation:
@book{galiana2025,
  author = {Galiana, Lino},
  title = {Python Pour La Data Science},
  date = {2025},
  url = {https://pythonds.linogaliana.fr/},
  doi = {10.5281/zenodo.8229676},
  langid = {en}
}
For attribution, please cite this work as:
Galiana, Lino. 2025. Python Pour La Data Science. https://doi.org/10.5281/zenodo.8229676.