TipPurpose of this chapter
- Scientific and technical approach to adopt when faced with a new dataset;
- Discover the main data providers in France and how to access their data;
- Discuss the ethical issues behind the work of data scientists and researchers in quantitative science
To begin working with a database effectively, it’s essential to ask some common-sense questions and follow a scientific approach, where some steps are quite straightforward.
In a data project, the steps can be schematically divided into four main parts:
- Data retrieval and structuring;
- Analysis of the data, including the production of descriptive statistics essential for guiding further explorations;
- Modeling;
- Finalizing and communicating results from the previous steps or implementing a production pipeline.
This course explores these different stages progressively using the comprehensive Python ecosystem. Each chapter of the course can be seen as a way to advance through this process.
In this chapter, we will focus on some considerations to make before starting each stage.
1 When retrieving data
1.1 Considerations to make in advance
The phase of constructing your dataset underpins the entire subsequent project.
The first question to ask is, “What data do I need to address my problem?” This problem might be refined depending on needs, but work is generally of higher quality when the problem prompts reflection on the available data rather than the other way around.
Next, “Who produces and provides this data?”
Are the sources available on the internet reliable?
Government open data sites are generally quite reliable but sometimes allow the archiving of data restructured by third parties rather than official producers. Conversely, on Kaggle or Github, the source of some datasets is not tracked, making it difficult to trust the quality of the data.
Once one or more data sources are identified, “Can I supplement them with additional data?” (In this case, be careful to ensure appropriate levels of granularity).
1.2 Who produces and disseminates data in France?
During the phase of searching for datasets, it is essential to know the key players who produce and disseminate data. Here is an overview of the French data dissemination ecosystem.
1.2.1 Insee and public statistics administrations
Firstly, statistical institutes like Insee (Institut National de la Statistique et des Études Économiques) in France, as well as ministerial statistical services (SSM)1, produce reliable data on various socioeconomic issues. These are aggregated statistics that, for some local data sources, can be very detailed. These statistics are produced through surveys, individual data from administrative files accessible under a 1951 law (see the section on data regulation 👇️), or through the exploitation of alternative data sources, such as those from private producers.
Insee also produces in-depth studies utilizing the data it generates, which are relevant to read when exploring a socioeconomic issue.
Among the best-sellers of the data sources available on insee.fr are census data, unemployment figures, inflation rate, GDP, and the names database. All these sources measured by Insee, which are so widely used in public debate, generally have international definitions to allow comparisons over time and space.
In this course, we will occasionally use data sources disseminated by Insee to provide contextual data at an aggregated level.
1.2.2 IGN for geographical datasets
IGN (Institut National de l’Information Géographique et Forestière) is another major player that produces and disseminates high-quality geographic and cartographic data in France. This data covers various aspects of the national territory, from topographic maps to land use information, and is essential for projects with a geographic dimension.
We will frequently use some of the map backgrounds produced by IGN in our spatial analysis chapters.
1.2.4 Contributory and crowd-sourced datasets
Initiatives such as OpenStreetMap, Wikidata, and OpenFoodFacts rely on the voluntary contributions of many users to produce and maintain datasets. These projects are particularly useful for obtaining geospatial data, encyclopedic information, or data on consumer products, respectively.
1.2.5 Data from private sector
Due to the digitization of the economy, many companies collect data on their users or customers as part of their activities. This data, often large and varied, can be used for various purposes, including market analysis or behavioral studies. While data exploitation is indeed central to some digital companies (particularly social networks), many actors internally exploit their customer data. In Europe, the regulatory framework since 2018 is the GDPR (General Data Protection Regulation), which defines the conditions for collecting, storing, and using personal data.
Some companies may also make this data, or an aggregated version of it, available through research projects or access via APIs. These can be useful for answering specific questions, provided one remembers that they are produced from a particular customer base and that extrapolation to the general population is not always possible.
1.3 Data structuring
Next comes the phase of formatting and cleaning the retrieved datasets. This step is crucial and is generally the one that requires the most time. For several years, the term data cleaning was used. However, this may have implicitly suggested that it was a subordinate task. The concept of data wrangling or feature engineering is now preferred, highlighting that it is a skill that requires significant expertise.
A clean dataset is one where the structure is appropriate and will not cause errors, visible or not, during the analysis phase. As we will define in the early chapters of the Manipulation section, the ideal structuring horizon is tidy data, i.e., organized in a well-structured table.
Here are some characteristics of a clean dataset:
- missing information is well understood and addressed.
NumpyandPandasoffer formalism on this topic that it is useful to adopt by replacing missing observations withNaN. This involves paying attention to how some producers code missing values: some have a tendency to be imaginative with codes for missing values: “-999”, “XXX”, “NA” - identifier variables are the same across tables (especially in the case of joins): same format, same categories…
- for textual variables, which can be poorly recorded, correct any possible errors (e.g., “Rolland Garros” -> “Roland Garros”)
- create variables that synthesize the information you need
- remove unnecessary elements (empty columns or rows)
- rename columns with understandable names
2 During descriptive analysis
Once the datasets are cleaned, you can more confidently study the information present in the data. This phase and the cleaning phase are not sequential; in reality, you will regularly move from cleaning to some descriptive statistics that reveal issues, and then back to cleaning, etc.
Questions to ask to “challenge” the dataset:
- Is my sample representative of what I am interested in? Having only 2000 municipalities out of 35000 is not necessarily a problem, but it’s good to have considered the question.
- Are the orders of magnitude correct? To assess this, compare your initial descriptive statistics with your internet research. For example, finding that houses sold in France in 2020 average 400 m² is not a realistic order of magnitude.
- Do I understand all the variables in my dataset? Do they “behave” as expected? At this stage, it can be useful to create a variable dictionary (explaining how they are constructed or calculated). Correlation studies between variables can also be conducted.
- Do I have any outliers, i.e., aberrant values for certain individuals? In this case, decide on the treatment (remove them, apply a logarithmic transformation, leave them as is) and justify it well.
- Do I have any key insights from my dataset? Do I have surprising results? If so, have I investigated them thoroughly to see if the results still hold or if it’s due to issues in the dataset construction (poorly cleaned, incorrect variable…)
3 During modeling
At this stage, descriptive analysis should have provided some initial clues on which direction to take your model. A beginner’s mistake is to dive straight into modeling because it seems like a more advanced skill. This often leads to poor quality analyses: modeling tends to confirm intuitions derived from descriptive analysis. If the latter has not been thoroughly conducted, interpreting model results can become unnecessarily complex.
A background in statistics and econometrics helps in developing better intuitions about the results from a model. It is useful to note that other courses in your statistical curriculum (Econometrics 1, Time Series, Surveys, Data Analysis, etc.) can help you find the most appropriate model for your question.
An important point to keep in mind is that the method will be guided by the objective and not the other way around. Among the questions to consider:
- Do you want to explain or predict? Depending on your answer to this question, you will not adopt the same scientific approach or algorithms.
- Do you want to classify an item into a category (supervised classification or unsupervised clustering) or predict a numerical value (regression)?
Depending on the models you have already encountered in your courses and the questions you wish to address with your dataset, the choice of model will often be quite straightforward.
4 During the results presentation phase
Sharing code on Github or Gitlab is a strong incentive to produce high-quality code. It is therefore recommended to systematically use these platforms for code sharing. This is actually a mandatory requirement for validating this course.
However, quality gains are not the only reason to adopt the use of Github or Gitlab on a daily basis. The course I teach with Romain Avouac in the third year of ENSAE (ensae-reproductibilite.github.io/website/) discusses one of the main benefits of using these platforms, namely the ability to automatically provide various deliverables to showcase your work to different audiences.
Depending on the target audience, communication will differ. The code may interest those wanting details on the methodology implemented in practice, but it may be a format that is off-putting to other audiences. Dynamic data visualizations will appeal to less data-savvy audiences but are harder to implement than standard charts.
CautionCaution
Jupyter notebooks have been very popular in the data science world for sharing work. However, they are not always the best format. Indeed, many notebooks tend to stack blocks of code and text, which makes them hard to read2.
For a substantial project, it is better to move as much code as possible into well-structured scripts and have a notebook that calls these scripts to produce outputs. Alternatively, consider using a different format (a dashboard, a website, an interactive app…).
In the final-year course at ENSAE, Data Science Project Deployment, Romain Avouac and I review alternative methods for code communication and sharing beyond notebooks.
This course uses notebooks because they are particularly well-suited for learning Python. The ability to insert text between code blocks and the interactivity are ideal for teaching purposes. Once you are more comfortable with Python, you can move beyond notebooks to executing scripts.
5 Ethics and responsibility
5.1 Reproducibility is important
Data is a synthetic representation of reality, and the conclusions of certain analyses can have a real impact on people’s lives. For instance, the erroneous figures presented by Reinhart and Rogoff (2010) were used as theoretical justification for austerity policies that had severe consequences for citizens in crisis-affected countries3. In Great Britain, the Covid-19 case counts in 2020, and thus the monitoring of the epidemic, were incomplete due to truncations caused by the use of an inappropriate data storage format (Excel spreadsheet)4.
Another example is the credit scoring system implemented in the United States. The following quote from Hurley and Adebayo (2016)’s article illustrates the consequences and problematic aspects of an automated credit scoring system:
Consumers have limited ability to identify and contest unfair credit decisions, and little chance to understand what steps they should take to improve their credit. Recent studies have also questioned the accuracy of the data used by these tools, in some cases identifying serious flaws that have a substantial bearing on lending decisions. Big-data tools may also risk creating a system of “creditworthinessby association” in which consumers’ familial, religious, social, and other affiliations determine their eligibility for an affordable loan.
Hurley and Adebayo (2016)
These problems are unfortunately quite structural in research. A team of Princeton researchers has discussed the “reproducibility crisis” in the field of machine learning due to numerous failures to replicate certain studies (Kapoor and Narayanan 2022). As Guinnane (2023) mentions, many studies in economic history rely on unfounded population figures.
Some academic journals have decided to implement a more transparent and reproducible approach. The American Economic Review (AER), one of the top 5 economics journals, has a rather proactive policy on the subject thanks to its data editor Lars Vilhuber.
5.2 Fighting cognitive biases
Transparency about the interests and limitations of a method used is therefore important. This research requirement, sometimes forgotten due to the race for innovative results, also deserves to be applied in business or administration. Even without a manifest intention from the person analyzing the data, misinterpretation is always possible.
While highlighting a result, it is possible to point out certain limitations. It is important, in research as well as in discussions with others, to be aware of confirmation bias, which consists of only considering information that aligns with our a priori beliefs and ignoring information that might contradict them:

Certain data representations should be excluded as cognitive biases can lead to erroneous interpretations5. In the field of data visualization, pie charts or radar charts should be excluded because the human eye poorly perceives these circular shapes. For a similar reason, color-filled maps (choropleth maps) can be misleading. Blog posts for datawrapper by Lisa Charlotte Muth or those by Eric Mauvière are excellent resources for learning good and bad practices in visualization (see the visualization section of this course for more details).
5.3 Data regulation
The regulatory framework for data protection has evolved in recent years with the GDPR. This regulation has helped to better understand that data collection is justified for more or less well-defined purposes. It is important to recognize that data confidentiality is justified to prevent the uncontrolled dissemination of information about individuals. Particularly sensitive data, such as health data, can be more challenging to handle than less sensitive data.
In Europe, for example, agents of public statistical services (e.g., Insee or ministerial statistical services) are bound by professional secrecy (Article L121-6 of the General Civil Service Code), which prohibits them from disclosing confidential information they hold as part of their duties, under penalty of sanctions provided for by Article 226-13 of the Penal Code (up to one year in prison and €15,000 fine). Statistical secrecy, defined in a 1951 law, strengthens this obligation in the case of data held for statistical purposes. It strictly prohibits the communication of individual data or data that could identify individuals, derived from statistical processing, whether these processes come from surveys or databases. Statistical secrecy generally excludes the dissemination of data that could allow the identification of the concerned individuals, both natural and legal persons. This obligation limits the granularity of the information available for dissemination.
This strict framework is explained by the legacy of World War II and the desire to avoid a situation where information collection serves a public action based on discrimination between categories of the population.
5.4 Sharing methods to reproduce an analysis
A recent article in Nature,
which discusses the work of an epidemiologists’ team (Gabelica, Bojčić, and Puljak 2022),
raises the issue of data access for researchers wanting to reproduce
a study. Even in scientific articles where it is mentioned that
data can be made available to other researchers, such sharing is rare:
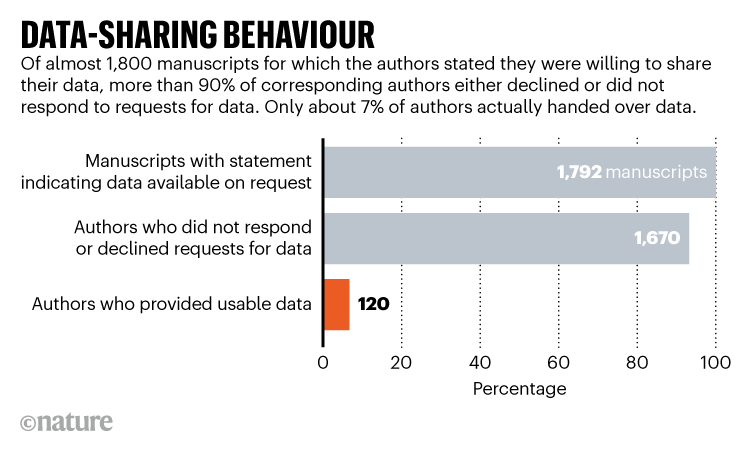
This somewhat concerning observation is confirmed by a recent study by Samuel and Mietchen (2023), which attempted to execute just under 30,000 notebooks associated with scientific studies. Only 3% of the notebooks reproduce the expected results.
To share the means of reproducing publications without disseminating potentially confidential data, synthetic datasets are increasingly used. Through Deep Learning models, it is possible to generate complex synthetic datasets that reproduce the main characteristics of a dataset while avoiding, if the model has been well-calibrated, the disclosure of individual information.
In French administration, source codes are considered administrative documents and can therefore be made available to any citizen upon request to the Commission for Access to Administrative Documents (CADA):
“Administrative documents, as defined in Titles I, III, and IV of this book, regardless of their date, place of storage, form, and medium, are documents produced or received in the course of their public service mission by the State, local authorities, as well as other public entities or private entities entrusted with such a mission. Such documents include, in particular, files, reports, studies, minutes, statistics, instructions, circulars, notes and ministerial responses, correspondence, opinions, forecasts, source codes and decisions.”
Opinion 20230314 - Session of 30/03/2023 of the Commission for Access to Administrative Documents
However, the weights of models used by the administration, particularly those of machine learning models, are not regulated in the same way (Opinion 20230314 from CADA). Indeed, as there is always a risk of reverse engineering leading to partial disclosure of training data when sharing a model, models trained on sensitive data (such as the judicial decisions studied in Opinion 20230314 from CADA) are not intended to be shared.
5.5 Adopting an ecological approach
Digital technology constitutes a growing share of greenhouse gas emissions. Currently representing 4% of global CO2 emissions, this share is expected to grow further (Arcep 2019). The field of data science is also concerned.
The use of increasingly massive data, particularly the creation of monumental text corpora, gathered through scraping, is a primary source of energy expenditure. Likewise, continuously collecting new digital traces requires maintaining functional servers continuously. In addition to this primary source of energy expenditure, training models can take days, even on very powerful architectures. Strubell, Ganesh, and McCallum (2019) estimates that training a state-of-the-art model in the field of NLP requires as much energy as five cars, on average, over their entire life cycle.
The increased use of continuous integration, which allows for automated execution of certain scripts or continuous production of deliverables, also leads to significant energy expenditure. Therefore, it is advisable to limit continuous integration to the production of truly new outputs.
NoteNote
For example, this book makes intensive use of
this approach. Nevertheless, to try to limit
the negative effects of continuously producing an
extensive book, only the modified chapters
are generated during the previews implemented for each pull request on the Github repository.
Data scientists need to be aware
of the implications of their intensive use of
resources and try to minimize their
impact. For example, rather than re-estimating
an NLP model, the transfer learning method,
which allows for transferring learning weights
from one model to a new source, helps
reduce computational needs.
Similarly, it may be useful to understand
the impact of excessively long code by
converting computation time into
greenhouse gas emissions.
The codecarbon
package provides this solution by adapting the estimate
based on the energy mix of the relevant country.
Measuring being a prerequisite to awareness and understanding,
such initiatives can lead to increased accountability
among data scientists and thus allow for
better resource sharing.
References
Arcep. 2019. “L’empreinte Carbone Du Numérique.” Rapport de l’Arcep.
Gabelica, Mirko, Ružica Bojčić, and Livia Puljak. 2022. “Many Researchers Were Not Compliant with Their Published Data Sharing Statement: Mixed-Methods Study.” Journal of Clinical Epidemiology.
Guinnane, Timothy W. 2023. “We Do Not Know the Population of Every Country in the World for the Past Two Thousand Years.” The Journal of Economic History 83 (3): 912–38.
Hurley, Mikella, and Julius Adebayo. 2016. “Credit Scoring in the Era of Big Data.” Yale JL & Tech. 18: 148.
Kapoor, Sayash, and Arvind Narayanan. 2022. “Leakage and the Reproducibility Crisis in ML-Based Science.” arXiv. https://doi.org/10.48550/ARXIV.2207.07048.
Reinhart, Carmen M, and Kenneth S Rogoff. 2010. “Growth in a Time of Debt.” American Economic Review 100 (2): 573–78.
Samuel, Sheeba, and Daniel Mietchen. 2023. “Computational Reproducibility of Jupyter Notebooks from Biomedical Publications.” https://arxiv.org/abs/2308.07333.
Strubell, Emma, Ananya Ganesh, and Andrew McCallum. 2019. “Energy and Policy Considerations for Deep Learning in NLP.” https://arxiv.org/abs/1906.02243.
Informations additionnelles
NotePython environment
This site was built automatically through a Github action using the Quarto
The environment used to obtain the results is reproducible via uv. The pyproject.toml file used to build this environment is available on the linogaliana/python-datascientist repository
pyproject.toml
[project]
name = "python-datascientist"
version = "0.1.0"
description = "Source code for Lino Galiana's Python for data science course"
readme = "README.md"
requires-python = ">=3.13,<3.14"
dependencies = [
    "altair>=6.0.0",
    "cartiflette",
    "contextily==1.6.2",
    "duckdb>=0.10.1",
    "folium>=0.19.6",
    "gdal==3.11.4",
    "graphviz==0.20.3",
    "great-tables>=0.12.0",
    "gt-extras>=0.0.8",
    "ipykernel>=6.29.5",
    "jupyter>=1.1.1",
    "jupyter-cache>=1.0.0",
    "kaleido>=0.2.1",
    "langchain-community>=0.3.27",
    "loguru==0.7.3",
    "markdown>=3.8",
    "nbclient>=0.10.0",
    "nbformat>=5.10.4",
    "nltk>=3.9.1",
    "pandas>=3.0",
    "pip>=25.1.1",
    "plotly>=6.1.2",
    "plotnine>=0.15",
    "polars>=1.8.2",
    "pyarrow>=17.0.0",
    "pynsee>=0.1.8",
    "python-dotenv>=1.0.1",
    "python-frontmatter>=1.1.0",
    "pywaffle>=1.1.1",
    "requests>=2.32.3",
    "scikit-image>=0.24.0",
    "scikit-learn>=1.8.0",
    "scipy>=1.13.0",
    "seaborn>=0.13.2",
    "selenium<4.39.0",
    "spacy>=3.8.4",
    "webdriver-manager>=4.0.2",
    "wordcloud==1.9.3",
]

[tool.uv.sources]
cartiflette = { git = "https://github.com/inseefrlab/cartiflette" }
gdal = [
  { index = "gdal-wheels", marker = "sys_platform == 'linux'" },
  { index = "geospatial_wheels", marker = "sys_platform == 'win32'" },
]

[[tool.uv.index]]
name = "geospatial_wheels"
url = "https://nathanjmcdougall.github.io/geospatial-wheels-index/"
explicit = true

[[tool.uv.index]]
name = "gdal-wheels"
url = "https://gitlab.com/api/v4/projects/61637378/packages/pypi/simple"
explicit = true

[dependency-groups]
dev = [
    "nb-clean>=4.0.1",
]
To use exactly the same environment (version of Python and packages), please refer to the documentation for uv.
NoteFile history
| SHA | Date | Author | Description |
|---|---|---|---|
| 99ab48b0 | 2025-07-25 18:50:15 | Lino Galiana | Utilisation des callout classiques pour les box notes and co (#629) |
| 94648290 | 2025-07-22 18:57:48 | Lino Galiana | Fix boxes now that it is better supported by jupyter (#628) |
| 91431fa2 | 2025-06-09 17:08:00 | Lino Galiana | Improve homepage hero banner (#612) |
| 5f08b572 | 2024-08-29 10:33:57 | Lino Galiana | Traduction de l’introduction (#551) |
| f8b04136 | 2024-08-28 15:15:04 | Lino Galiana | Révision complète de la partie introductive (#549) |
| c9f9f8a7 | 2024-04-24 15:09:35 | Lino Galiana | Dark mode and CSS improvements (#494) |
| d75641d7 | 2024-04-22 18:59:01 | Lino Galiana | Editorialisation des chapitres de manipulation de données (#491) |
| 005d89b8 | 2023-12-20 17:23:04 | Lino Galiana | Finalise l’affichage des statistiques Git (#478) |
| 4cd44f35 | 2023-12-11 17:37:50 | Antoine Palazzolo | Relecture NLP (#474) |
| 1f23de28 | 2023-12-01 17:25:36 | Lino Galiana | Stockage des images sur S3 (#466) |
| 652009df | 2023-10-09 13:56:34 | Lino Galiana | Finalise le cleaning (#430) |
| a7711832 | 2023-10-09 11:27:45 | Antoine Palazzolo | Relecture TD2 par Antoine (#418) |
| 154f09e4 | 2023-09-26 14:59:11 | Antoine Palazzolo | Des typos corrigées par Antoine (#411) |
| 6f206430 | 2023-09-25 14:33:20 | Lino Galiana | Correction lien mort cours ENSAE |
| 6dee48d4 | 2023-08-31 11:47:07 | linogaliana | Démarche scientifique |
| fb186dd1 | 2023-08-31 08:42:58 | linogaliana | Ajoute avis CADA |
| 9a4e2267 | 2023-08-28 17:11:52 | Lino Galiana | Action to check URL still exist (#399) |
| 80823022 | 2023-08-25 17:48:36 | Lino Galiana | Mise à jour des scripts de construction des notebooks (#395) |
| 3bdf3b06 | 2023-08-25 11:23:02 | Lino Galiana | Simplification de la structure 🤓 (#393) |
| 2dbf8533 | 2023-07-05 11:21:40 | Lino Galiana | Add nice featured images (#368) |
| b2d48237 | 2022-09-21 17:36:29 | Lino Galiana | Relec KA 21/09 (#273) |
| bacb5a01 | 2022-07-04 19:05:20 | Lino Galiana | Enrichir la partie elastic (#241) |
| 22d4b5ac | 2022-06-30 12:40:41 | Lino Galiana | Corrige la typo pour la ref (#245) |
| 5123634a | 2022-06-30 11:24:49 | Lino Galiana | Amélioration de la première partie (#244) |
| 12965bac | 2022-05-25 15:53:27 | Lino Galiana | :launch: Bascule vers quarto (#226) |
| 2f7b52d9 | 2021-07-20 17:37:03 | Lino Galiana | Improve notebooks automatic creation (#120) |
| aeb39950 | 2021-07-06 11:11:03 | avouacr | Relecture et ajouts sur anaconda + jupyter (#116) |
Footnotes
The French public statistical service consists of Insee and the 16 ministerial statistical services (SSM). These are the departments of ministries responsible for the production and dissemination of public service data. Unlike other departments to which the SSMs are attached, they are not solely focused on supporting public action operationally but primarily on providing quantitative elements useful for public debate and public action.↩︎
In the project submission guidelines (Evaluation section), we recommend avoiding monolithic notebooks and offer some solutions for this.↩︎
Reinhart and Rogoff’s article, “Growth in a Time of Debt”, relied on a manually constructed Excel file. A PhD student discovered errors in it and noted that when official figures were substituted, the results no longer had the same degree of validity.↩︎
It is assumed here that the erroneous message is transmitted without intention to deceive. Manifest manipulation is an even more serious problem.↩︎
It is assumed here that the erroneous message is transmitted without intention to deceive. Manifest manipulation is an even more serious problem.↩︎
Citation
BibTeX citation:
@book{galiana2025,
  author = {Galiana, Lino},
  title = {Python Pour La Data Science},
  date = {2025},
  url = {https://pythonds.linogaliana.fr/},
  doi = {10.5281/zenodo.8229676},
  langid = {en}
}
For attribution, please cite this work as:
Galiana, Lino. 2025. Python Pour La Data Science. https://doi.org/10.5281/zenodo.8229676.